Bitcoin (BTC) and ether (ETH) appear poised to continue trading in their current narrow ranges as many indicators flash neutral.
The two largest cryptocurrencies by market cap have seen volatilities lessen over the past seven days while momentum for both has fallen during the past 14 days.
The breather for both assets is unsurprising given their 43% and 38% year-to-date price increases. Those gains seemed outsized given the brewing uncertainties about crypto regulation, inflation and the economy.
BTC’s sharp rise to start the year followed a three-month period of flat trading activity.
Some crypto market observers may positively view the lack of profit taking following such a move higher. Currently, BTC and ETH are trading tightly to their 20-day moving averages, a price level that has demonstrated significant agreement between buyers and sellers in the past.
The Relative Strength Index (RSI), often used as a proxy to measure momentum, has fallen 20% since Feb. 15 to 55 for BTC. Ether’s RSI fell 12.5% to 54 over the same time period.
RSI is an indicator that ranges between 0-100, with a reading of 30 signaling that an asset may be oversold, and a reading over 70 indicating that it may be overbought. RSI readings near 50 indicate neither, and suggest that markets see both assets as fairly priced.
The cocktail of decreasing volatility, neutral momentum and significant price agreement could result in BTC and ETH trading in a relatively flat range, in lieu of a new catalyst.
Meanwhile, the Fear and Greed index for bitcoin sits exactly at a perfectly neutral 50 on a scale of 0-100.
On-chain analytics are painting a similar picture. Bitcoin’s Network Value to Transactions (NVT) ratio is currently 43.4, essentially identical to its six-month NVT ratio of 43.26. ETH’s NVT ratio is 108, an 6% premium to its six-month average of 101.75.
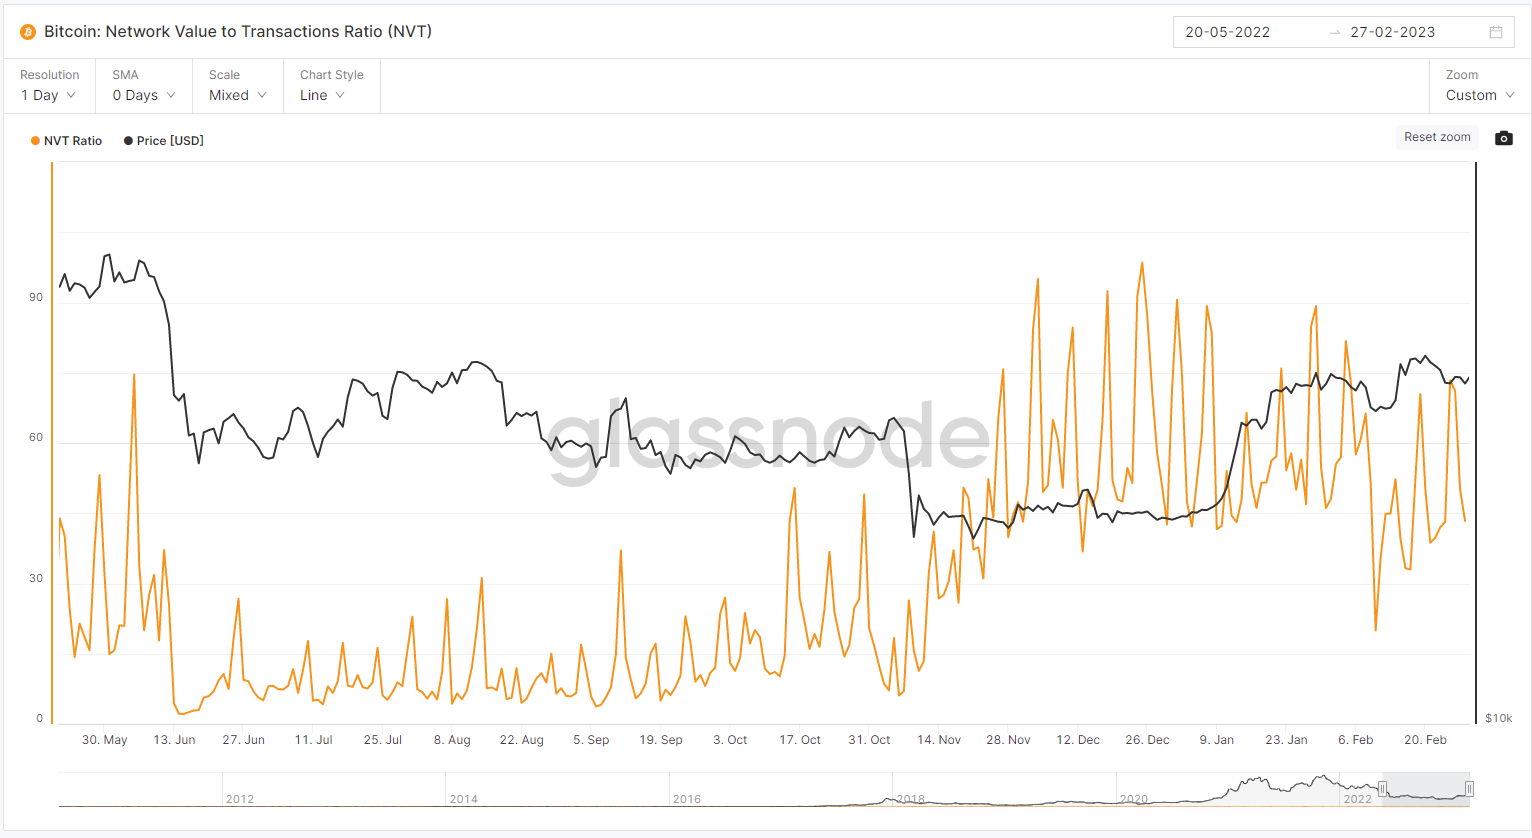
Bitcoin NVT ratio (Glassnode)
The NVT ratio is a valuation metric used in crypto markets and can be likened to the Price to Earnings (P/E) ratio in traditional finance. When an asset’s NVT falls below average, it indicates the asset is undervalued. Higher NVT levels indicate the opposite.
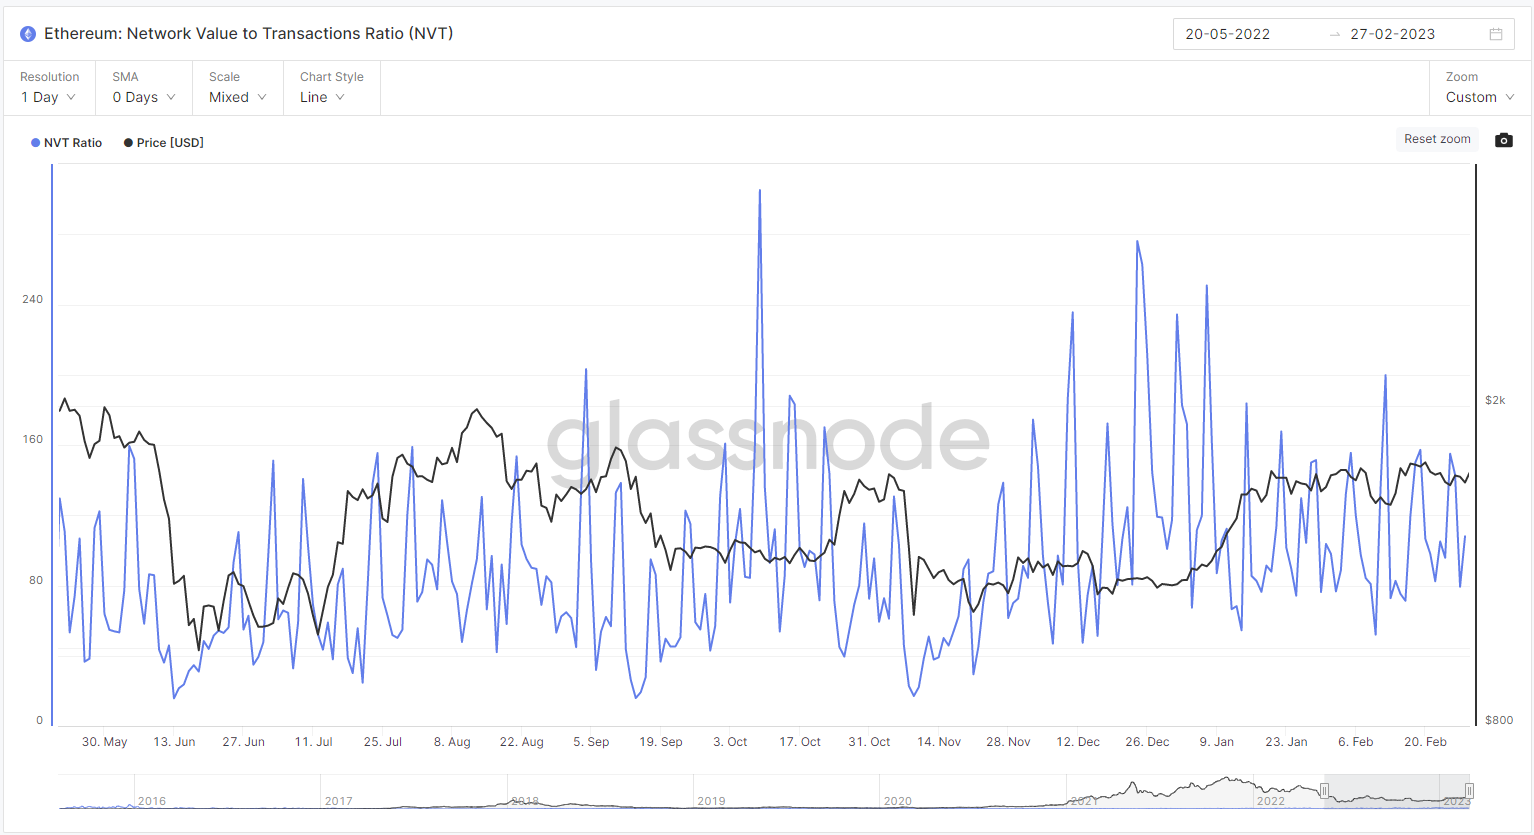
Ether NVT ratio (Glassnode)
All told, crypto markets appear to be in a holding pattern, and a significant bullish catalyst is not currently appearing on the horizon. Crypto holders have been reluctant to take profits following the move higher. The result is an asset that has plateaued while looking for the next directional signal.